Categories
Blockchain
Get started
Ecommerce & Digital Marketing
Cloud Computing & DevOps
Get started
Undergraduate Course
Mentor Giri Job Boosters DTGyan Refer & Earn Register Today

PG Program in Business Analytics

This Business Analytics course will help you prepare for career prospects. In developing their expertise in generating business strategies and devising plans for conducting a systematic study of company data and evaluating the best potential conclusion that will lead to achievement of business goals.

Program Overview

You'll learn about domains including banking and financial services, retail and e-commerce, pharmaceuticals and healthcare, and telecommunications and network from a functional standpoint. This involves workshops on project management, risk analysis, digital and social network analysis, and operational analysis.

Key Highlights

  • One-on-One with industry mentorsOne-on-One with industry mentors
  • 100% Placement Assistance100% Placement Assistance
  • 360 Degree Career Support360 Degree Career Support
  • Instant Doubt ResolutionInstant Doubt Resolution
  • Ideal for both Working Professionals and Fresh GraduatesIdeal for both Working Professionals and Fresh Graduates
  • Interactive LearningInteractive Learning

PG Program in Business Analytics

  1. $ 1,000
    • Best online Data science course
    • Best online Data science course
    • Best online Data science course
    • Best online Data science course
    13000+ learners
Features
  • 350+ hours of learning
  • Practice Test Included
  • Certificate of completion
  • Instant Doubt Resolution

Languages and Tools covered

  • Excel in Data Science program - online excel course
  • python in Data Science Program - online python course
  • tableau in Data Science program - online tableau course
  • NLP in Data Science - online NLP course
  • SQL in Data science course - online SQL course

5 Months PG Program in Business Analytics

Get elligible for 2 world-class certificates thus adding that extra edge to your resume

  • Course completion certificate from DataTrained Education
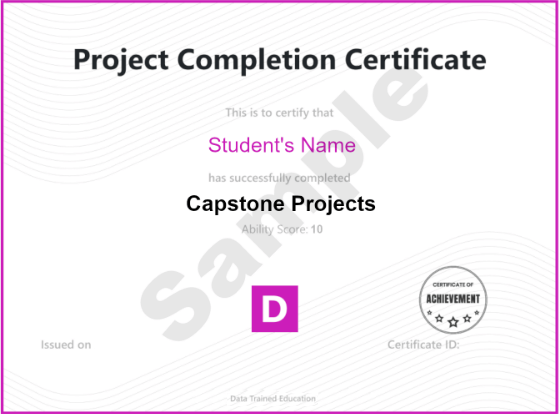
  • Project completion certificate from DataTrained Education

What’s the focus of this course?

This course empowers learners to become job-ready with PG Program in Business Analytics in just 5 months, using a variety of real-world industrial applications. Skilled Instructors, customized Education Structure, Reasonable Pricing Structure, Latest Technologies Covered , Live Industry Projects, and Placement Assistance are our key priorities.

Learn Anything, Anytime, Anywhere

Learn Anything, Anytime, Anywhere

Learn through our HD online videos by world class faculties and industry experts

Dedicated Career Assistance- data science program institute

Dedicated Career Assistance

Receive 1:1 career counseling sessions & mock interviews with hiring managers. Exhilarate your career with our 950+ hiring partners.

Student Support

Student Support

Chat support for Quick Doubt Resolution is available from 06 AM to 11 PM IST. Program Managers are available on call, chat and ticket during business hours.

Instructors

Join DataTrained certified curriculum and learn every skill from the industry's best thought leaders.

Dr. Deepika Sharma - Training Head, DataTrained
Dr. Deepika Sharma
Training Head, DataTrained

Dr. Deepika Sharma has been associated with academics /corporate education for more than 14 years. She has a deep passion in the field of Artificial Intelligence, Data Science, and Machine Learning.

Shankargouda Tegginmani - Data Scientist, Accenture
Shankargouda Tegginmani
Data Scientist, Accenture

Shankar is a Data Scientist with 14 Years of Experience. His current employment is with Accenture and has experience in telecom, healthcare, finance and banking products.

Sanket Maheshwari - Data Scientist, Faasos
Sanket Maheshwari
Data Scientist, Faasos

Experienced Data Scientist with a demonstrated history of working in the information technology and services industry.

SYLLABUS

Best-in-class content by leading faculty and industry leaders in the form of live sessions, pre-recorded HD videos, projects, case studies, industry webinars, and assignments

best data science courses online

Syllabus

Module 1 Advanced Excel
  • Overview_Excel
  • How To Write Down Data In Excel
  • Basic Formula
  • Overview_Function_ppt
  • Upper_lower_Function(All Basic Function Write Down)
  • Simple_if_Function,Sum_if(Simple_Conditional Formating)
  • Text_column and Multiple _if
  • Sum_if and Sum_ifs
  • Average_if and Average_ifs
  • Use Referances
  • LOOKUP
  • OverView Of Vlookup, Index, Hlookup
  • HLOOKUP, COMMENT
  • vlookup + match
  • vlookup
  • VLOOKUP WITH WILDCARD
  • VLOOKUP+CHOOSE+DSUM+DCOUNT
  • MATCH
  • INDEX_MATCH
  • IMAGE_LOOKUP
  • DATE_FUNCTION
  • DATE_DIFF
  • work_days and Network_days Function
  • CONSOLIDATE_REMOVE DUPLICATE
  • DATA TABLE
  • DATA_VALIDATION
  • FLASH_FILL+FREEZE PEN
  • GOAL SEEK AND SCEANIRYO
  • INDIRET_DEP
  • PIVOT_TABLE PPT
  • TIME
  • PIVOT_TABLE PRATICAL1
  • PIVOT_TABLE PRATICAL2
  • DOUBLE_VLOOKUP
  • FINANCIAL_FUNCTION
  • PIVOT_TABLE
  • PIVOT_TABLE_OPTION
  • PIVOT_TABLE_+REPORTFILTER
  • CHARTS_USING CONDITIONAL FORMATING
  • SPARKLINE
  • PIVOT_CHARTS
  • filter_pivottable
  • SUB_TOTAL
  • VISIBLE_CELLS_ONLY
  • PIVOT_TABLE_GROUP
  • GROUPING+CHARTS
  • WORKING WITH _OBJECTS
  • ONE_PIVOTTABLE WITH TWO SLICERS
  • DASHBOARD
  • MACRO
  • MACRO+CODING
  • MACRO EXAMPLES
  • CUSTOM_FORMATING
  • ADVANCE_FILTER
  • PIVOT_TABLE_NEW
  • MACRO_PPT
  • MACRO_DATABASE
  • ADVANCEFILTER+MACRO
  • RELATIVE_REFRENCES
  • MACRO_BASIC
  • form_contro
  • Option_control(checkbox+option)
  • DIFFERENCE_BETWEEN(ACTIVEX+FORM CONTROL)
  • COMBOBOX VALUE
  • FORM WITHOUT VBA
  • RELATIONSHIP_PIVOTTABLE
  • PASTE SPECIAL
Module 2 Tableau
Getting Started

Tableau is a visual platform for business intelligence and analytics which allows users to monitor, comprehend, observe, and make choices with a range of data. It allows you to produce any kind of graph, plot, or chart without scripting.

Data handling & summaries

You can learn how to handle various types of data, plot, analyze, sort, and summarise the entire data.

Building Advanced Reports/ Maps

Tableau Reports are a built-in feature of Tableau that allows users to display data from different sources into reports to better comprehend how far they have progressed toward their goals, better understand their customers' needs, and forecast future plans.

Calculated Fields

You will use calculated fields to generate new data from existing data in your data source. When you build a calculated field in your data source, you are efficient in including a new field (or column) whose values or members are determined by a computation that you control.

Table calculations

Table computations are modifications that can be applied to the data in a display. They are a kind of calculated field that works with Tableau's local data based on what is already in view.

Parameters

Parameters let you change a reference line, band, or box dynamically. For instance, reference a parameter rather than a reference line at a defined position on the axis. The reference line could be moved using parameter control.

Building Interactive Dashboards

An interactive dashboard allows you to dive down and filter operational data, allowing you to see data from multiple angles or in more depth. Dashboards allow data-driven business choices by providing a simplified and clear overview of overall business information.

Building Stories

A narrative in Tableau is a set of visuals that work together to present data. You can use tales to convey a data story, offer context, display how steps affect results or make a strong argument.

Working with Data

In this module, you will learn to join the tables, data blending and make connections, etc.

Sharing work with others

In this module, you will learn to share Workbooks, Publish to Reader/PDF and Publish to Tableau Server and share on the web.

Module 3 Power BI
Discover Data Analysis in Power BI

Power BI is an analytics tool that enables business users to analyze data and distribute insights throughout the organization at all levels. Through interactive and easy dashboards, Power BI offers an end-to-end view of important metrics and key performance indicators, all in real-time and in one place.

Get Started Building with Power BI

In this module, you will learn how to find Power BI services and apps that interact. Investigate how Power BI can help you to run your business more effectively, and figure out how to make eye-catching graphics and reports.

Get Data In Power BI

You will use Power BI to connect to data in text-based files, third-party directories, Microsoft Azure directories, along with web services like Google Analytics and SalesForce, among others. You will learn about how you can get the data in Power BI.

Clean, Transform and Load data in Power BI

Power Query offers a series of capabilities designed to help you in cleaning and preparing your data for analysis. For deeper analytics, you will learn ways to simplify a complicated model, alter data types, and rename items.

Design a Data Model In Power BI

It is about simplifying the chaos with regard to creating an outstanding data model. In this module, you will find out about the vocabulary and implementation of star schemas, which is one technique to simplify a data type. You will also learn why selecting the right data granularity is vital for Power BI report efficiency and readability.

Visualization in Power BI

Visualizations are representations of data insights. A Power BI report may have a single page with a single graphic or a lot of pages with multiple visuals. Visuals from reports can be connected to dashboards in the Power BI service.

Introduction to Creating Measures using DAX in Power BI

Data Analysis Expressions (DAX) is a scripting language that is used to create custom tables, measurements, or calculated columns in Microsoft Power BI. It is a set of capabilities, operators, and also constants that can be used to calculate and return one or more values using a formula, or expression.

Create dashboards in Power BI

Dashboards enable report users to make a single object of directed data that is created for particular requirements. Dashboards could be made up of different graphics pulled from various reports.

On Premises Data Gateway Management

Each service combines gateways differently and administration choices can change. This module pertains to the manage gateways page in Power BI, also, you will deal with gateways from any service.

Implement Row-Level Security

With Power BI, Row-Level Security (RLS) can be used to restrict data access for users. You can add filters inside roles to limit data access at the row level. In this module, you will learn how to set up RLS.

Work with AI Visuals in Power BI

With Power BI, row-level security (RLS) can be used to limit data access for users. You can build filters inside roles to restrict data access at the row level. With this module, you will learn how to set up RLS.

Create Paginated Reports

Paginated reports, as the name implies, can span many pages. They are formatted in a certain way and allow for exact modification. They are used to create paginated reports. The Power BI Report Server web portal, like the SQL Server Reporting Services (SSRS) website, allows you to save and control paginated reports.

Case Study

You will also get a chance to focus on multiple use cases that will enable you to improve your analytical.

Comprehensive Curriculum

The curriculum has been designed by faculty from IITs and Expert Industry Professionals.

100+ Hours of Content--- data science program institute
350+

Hours of Content

100+ Live Sessions--  data science online training
100+

Live Sessions

15 Tools and Software- best tools for data science
15

Tools and Software

Industry Projects

Real Time industry projects are covered that are running in Topnotch Companies that will enhance your Skill-set and provide you better career opportunities.

  • Data science program Engage in collaborative projects and learn from peers
  • Data science programMentoring by industry experts to learn and apply better
  • Data science programPersonalized subjective feedback on your submissions to facilitate improvement
Smartphone and Smartwatch Activity-- data science training in india

Smartphone and Smartwatch Activity

The crude accelerometer and whirligig sensor information is gathered from the cell phone and smartwatch at a pace of 20Hz.

Recommendation System-- best online data science programs

Recommendation System

In the connected world, it is imperative that the organizations are using to Recommend their Products & Services to the People.

Air Quality Study--- data science course near me

Air Quality Study

Based on The Data Collected from the Meteorological Department, Predicting The Air Quality Of Different Parts of The country

Why DataTrained for PG Program in Business Analytics in India?

DataTrained provides a fully packaged PG Program in Business Analytics course that includes professional mentors, the most up-to-date various technologies & tools, the best fee structure,100% job guarantee real-world project expertise, all at an attractive cost, making it the perfect PG Program in Business Analytics available till date.

Resume pepration by DataTrained

Partnered with IIMJobs wherein you get access to their paid resume preparation kit and personal feedback from the industry HR experts. An individual career profile is prepared by our experts so that it suits his/her experience and makes it relevant to a Data Scientist role.

Interview pepration DataTrained

Regular mock HR and Technical interviews by mentors with personal guidance and support. The industry mentor helps learners to take projects on Kaggle and move on to the status bar so that their resume looks competitive to the recruiters.

100% placement Assistance

We generate the Ability Score of every individual which is then sent to our more than 950+ recruitment partner organizations. At last, we organize campus placements quarterly in Noida, Gurgaon, Ahmedabad, Bangalore, and Chennai to place our students.

Career Impact

DataTrained presents the perfect PG Program in Business Analytics available in India with more than 10,000+ career transfers.

DataTrained has helped me with the vital knowledge and skills that are needed for a data scientist role. The trainer starts with an example to make us comprehend the concept and then help us build the Algorithms with the real industry datasets.DataTrained brings the power of online learning along with dedicated Mentorship, Counselling, Live Sessions and 6 months Internship.

Aaruni Khare-- Data Scientist
Aaruni Khare
Data Scientist

I saw an ad from DataTrained on facebook and I contacted them straight away and enquired about their Data Science online course. Their counselor took me through the complete journey of what they offer and what is data science all about. After continuous conversation for a few weeks, I was pretty sure about the course and now I knew where I need to invest my money and hard work.

Rakshit Jain- Data Scientist, Optum
Rakshit Jain
Data Scientist, Optum

The program is a well-balanced mix of pre-recorded classes, live sessions on weekends and printed reading materials they sent to my address. My mentor was Amit Kaushik and he helped me in getting that confidence and completing my assignments on time.I have almost completed the course and have been able to crack Glenmark interview.Thank you so much DataTrained.

Rupam Kumar Chaurasia-- Head Sales, Glenmark
Rupam Kumar Chaurasia
Head Sales, Glenmark

Our Student Work At

Disha Baluapuri Placed at Honeywell-- DataTrained Placement
Disha Baluapuri

Honeywell

8 LPA
Honeywell
Archit Khanduja Placed at Internshala-- DataTrained Placement
Archit Khanduja

Internshala

8 LPA
Internshala
Abhishek Murarka Placed at Firstsource Solutions-- DataTrained Placement
Abhishek Murarka

Firstsource Solutions

7.2 LPA
Firstsource Solutions
Surendra Singh Devda Placed at Indium Software--- DataTrained Placement
Surendra Singh Devda

Indium Software

6 LPA
Indium Software

After my graduation, I didn't want to pursue MBA since everyone is doing it I wanted to do something different but I was confused. I opted for the PG Program in Data Science by Data Trained Education and I had an amazing journey with them, the trainers were top-notch, the course content was perfect.

Hemant Patar Placed at Maganti IT services--- DataTrained Placement
Hemant Patar
Maganti IT services

I can certainly say the content they are offering is really good. Assignments are relatable. Completing the assignments helps in a better understanding of the module. In a nutshell, I would recommend this course to anyone interested in Data Science.

Amandeep Placed at Analytics Vidya-- DataTrained Placement
Amandeep
Analytics Vidya
Kumar Vaibhav Placed at HCL -- DataTrained Placement
Kumar Vaibhav

HCL

12 LPA
HCL
Abhinav Placed at MSMEx ---DataTrained Placement
Abhinav

MSMEx

6 LPA
MSMEx
Prathamesh Mishtry Placed at Deqode Solutions-- DataTrained Placement
Prathamesh Mishtry

Deqode Solutions

5.35LPA
Deqode Solutions
Abhistha Chatterjee Placed at Quantiphi --DataTrained Placement
Abhistha Chatterjee

Quantiphi

5 LPA
Quantiphi

Admission Process

There are 3 simple steps in the Admission Process that are detailed below

Step 1: Fill in a Query Form

Fill up the Query Form and one of our counselors will call you & understand your eligibility.

Step 2: Get Shortlisted & Receive a Call

Our Admissions Committee will review your profile. Upon qualifying, an Email will be sent to you confirming your admission to the Program.

Step 3: Block your Seat & Begin the Prep Course

Block your seat with a payment of INR 10,000 to enroll in the program. Begin with your Prep course and start your Business Analytics journey!

Program Fee

$ 1,000

No Cost EMI options are also available. *

I’m interested in this program

What's Included in the Price

Placements

Access to real-life projects

Access to domain specific mentorship

Access to career assist by IIMJobs

For Queries and Suggestions

Call DataTrained Now
Chat With Us
Call