Introduction To Google Data Scientist Interview Questions
“The goal of an interview session is to find the right person fit for the job, not just to fill a role. It is finding the right cord that will spark the fire that makes stuff work in real-time, and it is a two-way thing for both the interviewer and the interviewee.” ― Olawale Daniel
Google Data Scientist Interview questions are difficult to answer and pertain specifically to Google’s data products. To get hired at Google, you must have a Ph.D. in data science. Google data science interviewers want you to show that you’ve worked on real data science and machine learning projects.
Data Science is a fast-growing field, and Google has a wide range of positions for data scientists around the world. So what do you do?
In order to stand out from the crowd and make an impression on the hiring committee during the Google Data Scientist interview process, you’ll need to show off both your technical and non-technical abilities when answering Google Data Scientist interview questions. Your next technical interview and landing your dream job can be made easier with the help of the following Google Data Scientist interview questions and answers!

When it comes to your Google data scientist interview questions, you won’t get the same one word for word, but you must be able to decipher trends in these queries.
So that you can tackle fresh problems that use similar logic and approaches to those in the most expected Google data scientist interview questions, you should practice the most anticipated questions. Here are a few questions that you should be able to answer correctly.
Google Data Scientist Interview Questions for Machine Learning

Although machine learning interviews are standardized and structured in most organizations, there may be a significant variance among the type of questions that may be asked to a fresher, in contrast to an experienced candidate. We’ve bifurcated these categories so it’s easier to follow:
Google Data Scientist Interview Questions for freshers: Machine Learning
What do you understand by supervised and unsupervised machine learning?
The machine learning task of inferring a function from labeled training data is known as supervised learning. A set of training examples constitutes the training data. Support Vector Machines, Regression, Naive Bayes, Decision Trees, K-nearest Neighbor Algorithm, and Neural Networks are examples of algorithms.
For example, if you built a fruit classifier, the labels would be “this is an orange, this is an apple, and this is a banana,” based on examples of apples, oranges, and bananas shown to the classifier.

Whereas, Unsupervised learning is a type of machine learning algorithm that is used to draw conclusions from datasets that contain unlabeled input data. Clustering, Anomaly Detection, Neural Networks, and Latent Variable Models are examples of algorithms.
E.g. A fruit clustering will categorize “fruits with lots of dimples and soft skin,” “fruits with shiny hard skin,” and “elongated yellow fruits” in the same example.
What is the Purpose of Machine Learning?
The most straightforward response is to make our lives easier. Many systems used hardcoded rules of “if” and “else” decisions to process data or adjust user input in the early days of “intelligent” applications. Consider a spam filter, which is responsible for moving appropriate incoming email messages to a spam folder.
However, with machine learning algorithms, we provide enough information for the data to learn and identify patterns. Unlike traditional problems, we don’t need to write new rules for each machine learning problem; instead, we simply need to use the same workflow but with a different dataset.

What Are Machine Learning Algorithms and What Are Their Different Types?
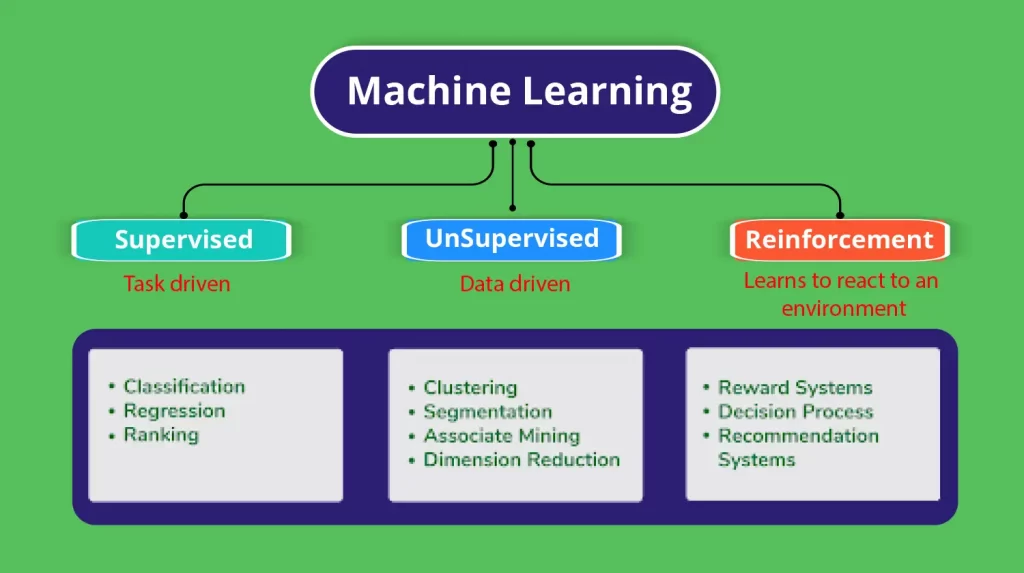
Machine learning algorithms come in a variety of shapes and sizes. Here’s a list of them organised by broad category:
- Whether or not they are taught under human supervision (Supervised, unsupervised, reinforcement learning).
- The criteria in the diagram below are not mutually exclusive; we can combine them in any way we see fit.
What is ‘Naive’ in a Naive Bayes?
The Naive Bayes method is a supervised learning algorithm that is naive because it assumes that all attributes are independent of each other by applying Bayes’ theorem.
Given the class variable y and the dependent vectors x1 through xn, Bayes’ theorem states the following relationship:
P(yi | x1,…, xn) =P(yi)P(x1,…, xn | yi)(P(x1,…, xn)
Using the naive conditional independence assumption that each xi is independent, we can simplify this relationship to:
P(xi | yi, x1, …, xi-1, xi+1, …., xn) = P(xi | yi)
Since, P(x1,…, xn) is a constant given the input, we can use the following classification rule:
P(yi | x1, …, xn) = P(y) ni=1P(xi | yi)P(x1,…,xn) and we can also use Maximum A Posteriori (MAP) estimation to estimate P(yi)and P(yi | xi) the former is then the relative frequency of class yin the training set.
P(yi | x1,…, xn) P(yi) ni=1P(xi | yi)
y = arg max P(yi)ni=1P(xi | yi)
The assumptions that different naive Bayes classifiers make about the distribution of P(yi | xi) vary a lot: Bernoulli, binomial, Gaussian, and so on.
What exactly is PCA? When are you going to use it?
The most common method for dimension reduction is principal component analysis (PCA). PCA measures the variation in each variable in this case (or column in the table). It discards the variable if there is little variation, as shown in the diagram below:
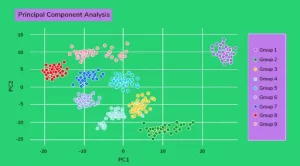
As a result, the dataset is easier to understand. PCA is used in a variety of fields, including finance, neuroscience, and pharmacology. It comes in handy as a preprocessing step, especially when features have linear correlations.
Describe the SVM algorithm in detail.
A Support Vector Machine (SVM) is a supervised machine learning model that can perform linear and non-linear classification, regression, and even outlier detection. Assume we’ve been given some data points, each of which belongs to one of two classes, and our goal is to distinguish between the two classes using a set of examples.
A data point in SVM is represented as a p-dimensional vector (a list of p numbers), and we wanted to see if we could separate them using a (p-1)-dimensional hyperplane. A linear classifier is what this is called.
The data is classified using a variety of hyperplanes. To select the best hyperplane that represents the greatest distance between the two classes.
If such a hyperplane exists, it is referred to as a maximum-margin hyperplane, and the linear classifier that it defines is referred to as a maximum margin classifier. The best hyperplane for dividing H3 data.
We have data (x1, y1), …, (xn, yn), and different features (xii, …, xip), and yiis either 1 or -1.
The equation of the hyperplane H3 is the set of points satisfying:
- x-b = 0
Where w is the normal vector of the hyperplane. The parameter b||w||determines the offset of the hyperplane from the original along the normal vector w
So for each i, either xiis in the hyperplane of 1 or -1. Basically, xisatisfi
es:
w . xi – b = 1 or w. xi – b = -1

In SVM, what are Support Vectors?
A Support Vector Machine (SVM) is an algorithm that tries to fit a line (or plane or hyperplane) between the different classes that maximizes the distance between the line and the classes’ points.
It tries to find a strong separation between the classes in this way. The Support Vectors are the points on the dividing hyperplane’s edge, as shown in the diagram below.

What Are SVM’s Different Kernels?
In SVM, there are six different types of kernels:
- When data is linearly separable, a linear kernel is used.
- When you have discrete data with no natural notion of smoothness, you can use a polynomial kernel.
- Create a decision boundary with a radial basis kernel that can separate two classes much better than a linear kernel.
- The sigmoid kernel is a neural network activation function.
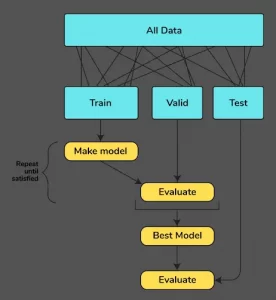
What is Cross-Validation, and how does it work?
Cross-validation is a technique for dividing your data into three sections: training, testing, and validation. The data is divided into k subsets, and the model has been trained on k-1 of them.
The final subset will be used for testing. This is repeated for each subset. This is referred to as k-fold cross-validation. Finally, the final score is calculated by averaging the scores from all of the k-folds.
Machine Learning interview questions for Experienced
What is the difference between the bagged model and boosted model?
Bagging attempts to implement similar learners on small sample populations before averaging all predictions. Different learners can be used on different populations in generalized bagging. As you might expect, this assists us in reducing the variance error.
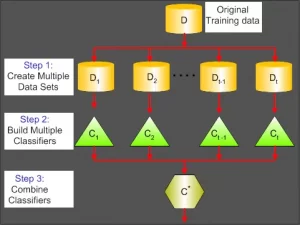
Boosting is an iterative technique for adjusting the weight of an observation based on its previous classification. If an observation is incorrectly classified, it attempts to increase its weight, and vice versa. Boosting, in general, reduces bias error and helps to build strong predictive models. They may, however, overfit the training data.

How would you differentiate between K-mean and EM?
The K-Means process involves assigning each observation to a cluster, while the EM (Expectation-Maximization) process involves determining the likelihood of an observation belonging to a cluster (probability).
What methods would you use to detect anomalies in AI?
LOF, autoencoders, and Bayesian networks are some of the common ML methods used in anomaly detection.
What do you understand about the Rectified Linear Unit in Machine Learning?
Rectified Linear Units (RLUs) are a type of activation function that is frequently used in deep learning models. In essence, the function returns 0 if the input is negative, and 1 if the input is positive.
The function will always return a positive value. f(x)=max(0,x) is the function’s definition
The rectified linear unit, also known as the ReLU, allows the deep learning model to account for non-linearities and specific interaction effects.
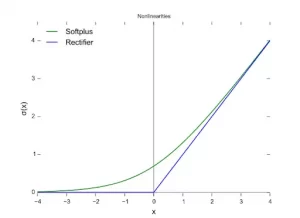
The ReLU function is graphically represented in the image above. It’s worth noting that any negative X input results in a 0 output, and the function only starts to slope upward once positive values are entered.
What is the AdaGrad algorithm in Machine Learning?
Adaptive Gradients, or AdaGrad for short, is a variation of the gradient descent optimization algorithm that allows the step size in each dimension to be automatically adjusted based on the gradients seen for the variable (partial derivatives) seen during the search.
What is AUC? What are evaluation metrics in AI and Machine Learning?
The Area Under the Curve (AUC) is a summary of the ROC curve that measures a classifier’s ability to distinguish between classes. The AUC indicates how well the model distinguishes between positive and negative classes. The higher the AUC, the better.
The quality of a statistical or machine learning model is measured using evaluation metrics. Any project requires evaluating machine learning models or algorithms. There are a variety of evaluation metrics that can be used to test a model.
Classification accuracy, logarithmic loss, confusion matrix, and other metrics are among them. The number of correct predictions to the total number of input samples is the ratio of classification accuracy, which is what we usually refer to when we use the term accuracy.
Logarithmic loss, also known as log loss, penalizes incorrect classifications. A confusion matrix produces a matrix as an output and describes the model’s overall performance. There are other evaluation metrics that haven’t been mentioned that can be used. The use of a combination of these individual evaluation metrics to test a model or algorithm is known as evaluation metrics.
What are the applications of Feature Selection in AI?
The feature selection methodology is used in a variety of applications such as data mining, machine learning, and pattern recognition to reduce the dimensionality of a feature space and improve the classification algorithm’s predictive accuracy.
How would you encode a categorical variable with thousands of distinct values?
Because a large number of distinct values will result in large dimensionality problems (Curse of Dimensionality) in the modelling stage, one-hot encoding is not an option.
One-shot encoding is appropriate for categorical variables that have no ordinal relationship. Convert a single value to a binary vector with all 0 values except the encoded label’s index, which is marked with 1.
Depending on whether they have a directional relationship, the next option is label or ordinal encoding. Label encoding is the process of converting a unique value into an integer. Ordinal encoding is a method of converting a single value to an integer in a specific order to express a directional relationship. For example, (cold, warm, hot->1,2,3)
What steps will you take to design and build the recommendation algorithm for a type-ahead search for Google?
There are essentially three steps you’ll take to design and build the recommendation algorithm for a type-ahead search for Google.
- Trees: By indexing searchable text in a tree structure (prefix tree, suffix tree, dawg, etc. ), very fast searches can be performed at the cost of memory storage. For approximate matching, the tree traversal can be modified.
- Pattern Partitioning: A simple hashing scheme can be used to search for pattern occurrences by partitioning the text into tokens (ngrams).
- Filtering: Create a list of potential matches, then check each one with a sequential algorithm.
The goal of asking such questions based on machine learning in an interview is to assess your technical skills and knowledge in the field of data science. The best tip on how to answer these questions is to suggest various methods to solve a single problem, include examples to show your deeper understanding, and give reasons for your choice with c
ontrast and comparison to other algorithms. Doing so will help create a better image in the mind of your interviewer that you have what it takes.
Statistics Interview Questions for Data Science : At Google

Google Data Scientist Interview Questions for Freshers : Statistics
How is the statistical significance of an insight determined?
Hypothesis testing is used to determine the statistical significance of the insight. To elaborate, the null hypothesis and alternate hypothesis are stated, and the p-value is calculated.
After calculating the p-value, the null hypothesis is assumed to be true, and the values are determined. The alpha value, which denotes the significance, is tweaked to fine-tune the result. If the p-value is less than the alpha, the null hypothesis is rejected. This ensures that the outcome is statistically significant.
Where are long-tailed distributions used?
A long-tailed distribution is one in which the tail gradually decreases toward the end of the curve. The Pareto principle and product sales distribution are good examples of how to use long-tailed distributions. It is also widely used in classification and regression problems.
What is the central limit theorem?
The central limit theorem states that the normal distribution is obtained when the sample size varies without affecting the shape of the population distribution. This central limit theorem is critical because it is widely used in hypothesis testing and accurately calculating confidence intervals.
In Statistics, what is the difference between observational and experimental data?
Observational data is data obtained from observational studies in which variables are observed to see if there is any correlation between them. Experimental data is derived from experimental studies in which certain variables are held constant to see if any discrepancy in the working is raised.
What is meant by mean imputation for missing data? What’s the problem?
Mean imputation is a rarely used practice in which null values in a dataset are directly replaced with the data’s mean. It is considered a bad practise because it completely removes accountability for feature correlation. This also implies that the data will have low variance and increased bias, contributing to the model’s accuracy dip as well as narrower confidence intervals.
What is an outlier? How are outliers in a dataset identified?
Outliers are data points that differ significantly from other observations in the dataset. Depending on the learning process, an outlier can significantly reduce the accuracy and efficiency of a model. Outliers are identified using two methods:
- Standard deviation/z-score
- Interquartile range (IQR)
How is missing data handled in statistics?
In Statistics, there are numerous methods for dealing with missing data:
- Missing value prediction
- Individual (one-of-a-kind) value assignment
- Rows with missing data are deleted.
- Imputation by mean or median
- Using random forests to support missing values
What exactly is exploratory data analysis?
Exploratory data analysis is the process of conducting investigations on data in order to better understand the data. Initial investigations are carried out to identify patterns, detect abnormalities, test hypotheses, and ensure that the assumptions are correct.
What is the definition of selection bias?
Selection bias is a phenomenon that involves the non-random selection of individual or grouped data. Randomization is critical in performing analysis and better understanding model functionality. If proper randomization is not achieved, the resulting sample will not accurately represent the population.
What are the various types of statistical selection bias?
As illustrated below, there are several types of selection bias:
- Observer selection
- Attrition
- Protopathic bias
- Time intervals
- Bias in sample selection
For Experienced
In what scenarios are outliers retained in the data?
Outliers are not kept in the data in many cases, but they are kept in a few critical cases. They are saved in the data for analysis if and only if the following conditions are met:
- The outcome is critical.
- Outliers provide context to the data.
- The data is skewed significantly.
Explain briefly the procedure for measuring the length of all sharks on the planet.
The following steps can be used to determine shark length:
- Determine your level of confidence (usually around 95 percent )
- To measure, use sample sharks.
- Determine the lengths’ mean and standard deviation.
- Calculate the t-statistics values
- Determine the confidence interval around the mean length
What effect does length have on the width of the confidence interval?
The width of the confidence interval is used to determine the next steps in the decision-making process. As the level of confidence rises, so does the width. The following are also applicable:
- Wide confidence intervals: useless data
- High-risk factor with a narrow confidence interval
What does degrees of freedom (DF) mean in statistics?
When performing an analysis, degrees of freedom (DF) are used to define the number of options available. It is most commonly associated with the t-distribution and not with the z-distribution.
When the DF increases, the t-distribution approaches the normal distribution. If DF is greater than 30, the t-distribution has all of the characteristics of a normal distribution.
How do you compute the p-value in Microsoft Excel?
The following steps are taken to easily calculate the p-value:
- Locate the Data tab above.
- Select Data Analysis.
- Choose Descriptive Statistics
- Choose the appropriate column.
- Enter the confidence level of
What is the statistical law of large numbers?
In statistics, the law of large numbers is a theory that states that increasing the number of trials performed results in a positive proportional increase in the average of the results becoming the expected value.
When a fair coin is flipped 100,000 times, the probability of landing heads is closer to 0.5 than when it is flipped 100 times.
What are some of the characteristics of a normal distribution?
A normal distribution, regardless of size, will have a symmetric bell-shaped curve along the axes. Some of the important properties are as follows:
- Unimodal: It only has one mode.
- Symmetrical: The curve’s left and right halves are mirrored.
- Central Tendency: The mean, median, and mode are all at the midpoint of the distribution.
If there is a 30% chance that you will see a supercar in any 20-minute time interval, what is the chance that you will see at least one supercar in an hour (60 minutes)?
The chances of not seeing a supercar in 20 minutes are as follows:
= 1 – P(Observing one supercar)
= 1 – 0.3
= 0.7
The likelihood of not seeing a supercar in 60 minutes is:
(0.73) ^ 3 = 0.343
As a result, the likelihood of seeing at least one supercar in 60 minutes is:
= 1 – P(No supercars seen)
= 1 – 0.343
= 0.657 59.
What does sensitivity in statistics mean?
As the name implies, sensitivity is used to determine the accuracy of a classifier (logistic, random forest, etc.). The following is a simple formula for calculating sensitivity:
Predicted True Events/Total Number of Events = Sensitivity
What kinds of biases can you encounter while sampling?
Biases are classified into three types:
- Bias in selection
- Survivorship prejudice
- Due to coverage bias
What does TF/IDF vectorization mean?
Term Frequency – Inverse Document Frequency is an abbreviation for Term Frequency – Inverse Document Frequency. It is a numerical measure used to indicate the importance of a word in a document. This document is commonly referred to as the collection or the corpus.
The TF-IDF value is proportional to how many times a word appears in a document. TF-IDF is important in the field of Natural Language Processing (NLP) because it is commonly used in text mining and information retrieval.
The above mentioned are some of the most commonly asked google data scientist interview questions. The aim of asking statistical questions in any data science interview is to have a clear understanding of how much the candidate knows about the implications and applications of statistics in the field of Data Science.
For advanced machine learning algorithms, data patterns are captured and translated into actionable evidence through the use of statistics. Researchers in the field of data science use statistical methods to collect, examine, examine the results of, and draw conclusions about data.
The best tip to answer statistical questions is to focus and sharpen your fundamentals such as Probability, Central Tendency, Variability, Relationship Between Variables, Probability Distribution, Hypothesis Testing, Statistical Significance, and Regression.
Coding

If you want to become a data scientist at Google, you’ll need extensive knowledge of coding. SQL, data analysis, and Python coding are all part of the Google data scientist interview process.
To be successful in this round of interviews, you’ll need to prepare for as many Google data scientist interview questions as possible on data structures and algorithms. Coding rounds should focus on the following:
- Linked List
- Recursion
- Bit Manipulation
- Binary Tree Example Code
- Strings and Arrays
- Small Programs (string, memory functions)
Here are some samples:
- In a normal distribution, write a function to generate N samples. Also, plot a histogram.
- Write a program to read a text file using a series of tweets. Output- two text files where the first one lists all the unique words in the tweets and the number of words that get repeated. Your second will contain the average number of unique words in all the tweets.
- Given two data frames where one contains information about addresses, and the other data frame has relationships between various cities and states. Write a function to create a single data frame with complete addresses (format-street, city, state, zip code).
- For a given percentile threshold and N samples, write a function to simulate a truncated normal distribution.
Hungry for more? Here are some less common, yet important questions you should solve:
- With which programming languages and environments are you most comfortable working?
- Have you used any online platforms for machine learning such as Azure ML or PredictionIO?
- How would you train and deploy a logistic regression model? A recommender system?
- Describe a data science project with a substantial programming component in which you have worked?
- How would you sort a large list of numbers?
- What is hashing? Give an example of when you might want to use it
- What is dynamic programming? What is recursion?
- How do you test your code? What kind of tests do you write?
- How would you monitor that the performance of a model you trained does not degrade over time?
- Suppose you wanted to keep a record of some computations that your model performs while in production. How would you go about doing this?
- Are you familiar with version control? What tools and processes have you used for this?
- What are software patterns? With which patterns are you familiar? When might you use a Factory/Singleton/Memento/Builder/DAO etc. pattern?
- Have you ever worked within a developer team that followed a particular agile process?
- What is technical debt, how does one mitigate it, and how relevant is this to deploying data driven models in the real world?
- How might you deploy a model that was training in an environment such as R? Are you familiar with PMML?
The aim of asking coding questions in a data science interview is to assess you on the fundamentals of programming which is used in a role of a data scientist. These fundamentals are:
Data structures: Examine data structures such as arrays, strings, heaps, sets, hashmaps/dictionaries, stacks/queues, and tree/binary tree. Algorithms such as dynamic programming, recursion, binary search, and sorting should also be studied.
Machine learning: Investigate the families of supervised and unsupervised machine learning models. Review the k-means clustering unsupervised learning model, for example, and investigate supervised learning models such as decision trees, k-nearest neighbors, logistic regression, and linear regression.
Mathematics and statistics: Review simulation-related math and statistics concepts such as weighted sampling, Monte Carlo simulations, and simulating Markov chains. It’s also important to learn about prime numbers and divisibility concepts, such as the Euclidean algorithm and natural number division calculations.
The best tip to tackle these questions effectively is to practice as many coding questions as you can.
Google Behavioral Interview Questions

In addition to assessing your technical skills, Google data scientist interview questions look into your personality. How would you respond in similar work situations is what the Google behavioral interview questions process is all about. If you’re applying for a job, you must go through a mandatory behavioral round. An interviewer’s decision rests on your answers to these questions.
Here are some questions Google asks about your behavior:
- Describe a past data science project you worked on.
- How do you prioritize tasks when working on many different projects?
- How do you complete multiple projects under tight time constraints?
- What is the best way to maintain a work-life balance?
- What makes you interested in this Data Scientist position at Google?
- What is it about Google’s culture that you like the most?
- What career goals do you have? How do you plan to achieve them?
- Do you have a favorite Google product? What do you love about it?
- Describe a time when a project you were working on wasn’t successful. What did you learn?
- How would you handle an uncooperative co-worker?
Now you’re thinking, that’s all well, but how do I answer these questions? The STAR (Situation, Task, Action, Result) method provides effective responses to Google behavioral interview questions. Context is provided by describing the situation or problem, outlining tasks to respond to or solve it, explaining actions taken to that effect and emphasizing (quantified and positive) results or outcomes of thi
s process.
Situation
Begin your response by explaining the situation to your interviewer. What did you do? Were you a member of a team or a product leader? How did the market react to your products or services? Set the stage so that your interviewer understands how to frame your previous experiences.
Task
What was the issue that your team was dealing with? Don’t start your problem-solving process just yet! Your hiring manager must understand the problem you were attempting to solve. Did your new feature receive negative feedback from users? Did a database containing sensitive information crash? What were you working on or what problem were you attempting to solve?
Action
After you’ve set the tone for your interview question response, you’ll want to get down to business. Difficult projects necessitate innovative solutions. Explain in detail how your previous experience led you to a solution. Discuss specific steps you took to address the problem or task.
Results and Impact
Finally, discuss your outcomes and impact. What positive results resulted from your example? Whatever role you play at Google, how you define success will be critical. To emphasize your point, use specific numbers, revenue, or tangible examples.
Product Awareness

- How could you test if a metric has increased on a change you made in a Google app?
- How do you detect inappropriate content on YouTube?
- What Data Science-based product will you build for Google and why?
- How would you evaluate if upgrading the android app enhances searches?
- How to design a customer satisfaction survey?
- What do you understand about Hadoop architecture?
- What are the methods and techniques for anomaly detection?
- How do you think Data Science can contribute to Smart City development?
- How would you account for users’ likes on videos?
- Why would you choose GBM over logistic regression?
- How can NoSQL databases be better than SQL databases?
- What procedure will you follow to resolve the issue of bias in case of removal of missing values from a database?
- How will you test the changes you have made to a mobile app for a business firm?
- What is caching in Data Science? Explain how it works.
Google asks product sense interview questions for a variety of reasons, including testing your ability to diagnose and solve real product problems, determining your familiarity with the company’s products and business, determining how practical your solution to a problem is, assessing your ability to define and understand the impact and tradeoffs of metrics, and determining your ability to communicate your solution in an effective and structured manner. If you can inculcate all this in your Google Data Scientist interview preparation, then nothing can stop you from landing a job.
Some tips to answer these questions in the best capacity:
- Conduct company research and become acquainted with their core products. Reading company news on sites like TechCrunch is a good place to start. If the company is publicly traded, read its quarterly earnings report and understand its business model and primary revenue source.
- Use a framework to organize your responses to those questions. We’ve seen a lot of smart people come up with a lot of ‘innovative’ product solutions without a clear plan for prioritizing those tasks and ideas. The interviewer does not anticipate you to be a product visionary.
- Instead of saying Monthly Active User, use something more precise and straightforward to calculate: the number of users who signed in and streamed at least 10 minutes of video content in the previous 28 days.
Some Final Tips

- You must have a diverse skill set to succeed in the Google data scientist interview. The Google data scientist interview questions listed above are just a sampling of the topics covered in the interviews.
- Mock practice for Google Data Scientist Interview can help you prepare for situation-based questions asked in the final rounds of on-site interviews. To effectively demonstrate analytical and problem-solving skills, you must take your time answering each question. Your responses should demonstrate a rational mindset as well as critical thinking abilities.
- You should work on your technical abilities as well as your communication, analytical, and decision-making skills to ace your Google Data Scientist Interview.
- A thorough understanding of and familiarity with Google products is essential. Your in-depth knowledge of Google’s business and the organization’s timeline can help you outperform other candidates.
- Refresh your programming and database language knowledge. You should be familiar with both fundamental concepts and advanced problems. Google has high standards for its new hires. You must gain programming experiences, such as with R or Python. It is best, to begin with, the fundamentals, such as working on the syntax and commands for the specific language, before moving on to algorithm design and development.
- The Google data scientist interview questions cover topics such as strategy development and management if you are applying for a senior data scientist position. You can hone your skills by practicing such question sessions with coworkers or friends.
Related Reading: How to become a Google Data Scientist
Frequently Asked Questions
Are coding questions included in Google Data Scientist interview questions?
Here in the google data scientist interview the Phone interviews typically focus on fundamental concepts, but Google data scientist interview also includes statistical and coding questions. You will be coding in a programming language of your choice in real-time on a shared document. As you work on the Google data scientist interview questions, you must clearly communicate your steps and reasoning.
How should I prepare for Google Behavioral interview questions for becoming Data Scientist?
You must compile a list of relevant data science projects and accomplishments to discuss while answering Google Data Scientist interview behavioral interview questions. Take some mock interviews and practice the most common Google data scientist interview questions.
How do you respond to Google Data Scientist interview questions about product sense?
Answering Google data scientist interview questions on product sense will require you to use your statistical and coding skills. You must demonstrate technical knowledge that will aid in the testing and driving of business and product decisions.
Is a Google Data Scientist interview difficult to land?
The questions are challenging, Google-specific, and cover a wide range of topics. However, a proper approach to your Google Data Scientist interview preparation can help you ace the interview and land a Google offer.
What is the role of a Google data scientist?
In Google Data Scientist interview, he is in charge of optimizing and analyzing Google’s products. Data Scientists work with analysts and engineers to solve complex problems. At Google, a Data Scientist’s responsibilities include working with large and complex data sets.
What is better data analyst or data scientist?
Data Analyst and Data Scientist are positions that are in high demand. Many students and working professionals aspire to work in these fields. A Data Analyst position is better suited for those looking to begin a career in analytics and this blog of Google Data Scientist Interview.
A Data Scientist position is recommended for those who want to create advanced machine learning models and use deep learning techniques to aid in the performance of human tasks.